%matplotlib inline
Visualize input data of different spatial technologies
There are great numbers of emerging technologies of image-based spatial technologies. They mainly include three branches. First one is in-situ hybridization based technologies, such as MERFISH and SeqFISH. Second one is in-situ sequencing based technologies, such as STARMap and FISSeq. Third one is sequencing-bead based technologies, such as Stereo-seq, which reach subcellular-resolution spatial data due to small bead sizes.
This tutorial shows how the input data of different spatial technologies look like.
Import packages & data
import numpy as np
import pandas as pd
import matplotlib.pyplot as plt

import Bering as br
Define the visualization function
def visualize_spots(df_spots_all):
    df_spots_seg = df_spots_all[df_spots_all['labels'] != 'background'] # foreground nodes
    df_spots_unseg = df_spots_all[df_spots_all['labels'] == 'background'] # background nodes

    # visualize the spots
    x, y = df_spots_seg['x'].values, df_spots_seg['y'].values
    cell_types = df_spots_seg['labels'].values

    fig, ax = plt.subplots(figsize = (6, 6))
    for idx, cell_type in enumerate(np.unique(cell_types)):

        xc = x[np.where(cell_types == cell_type)[0]]
        yc = y[np.where(cell_types == cell_type)[0]]

        ax.scatter(xc, yc, s = 0.03, label = cell_type, color = np.random.rand(3,))

    xb, yb = df_spots_unseg['x'].values, df_spots_unseg['y'].values
    ax.scatter(xb, yb, color = '#DCDCDC', alpha = 0.2, s = 0.015, label = 'background')

    h, l = ax.get_legend_handles_labels()
    plt.legend(h, l, loc = 'upper right', fontsize = 8, markerscale = 15)
1. MERFISH Cortex data
This MERFISH data is from [Zhang et al., 2021]. Gray dots are unsegmented spots from original paper.
df_spots_all = br.datasets.merfish_cortex_zhang()
visualize_spots(df_spots_all)
Downloading dataset `merfish_cortex_zhang` from `https://figshare.com/ndownloader/files/41409090` as `None.tsv`

2. Nanostring CoxMx Non-small-cell Lung Cancer data
This Nanostring CosMx data is from [He et al., 2022]
df_spots_all = br.datasets.cosmx_nsclc_he()
visualize_spots(df_spots_all)
Downloading dataset `cosmx_nsclc_he` from `https://figshare.com/ndownloader/files/41409093` as `None.tsv`

3. pciSeq Hippocampus data
This pciSeq data is from [Qian et al., 2020]
df_spots_all = br.datasets.iss_ca1_qian()
visualize_spots(df_spots_all)
Downloading dataset `iss_ca1_qian` from `https://figshare.com/ndownloader/files/41409096` as `None.tsv`

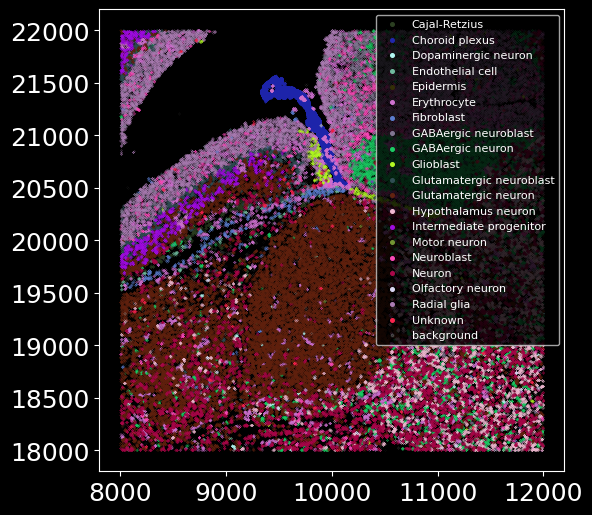
4. Stereo-seq Embryo Brain data
This Stereo-seq data is from [Chen et al., 2022]
df_spots_all = br.datasets.stereoseq_embryobrain_chen()
visualize_spots(df_spots_all)
Downloading dataset `stereoseq_embryobrain_chen` from `https://figshare.com/ndownloader/files/41409105` as `None.tsv`
5. 10x Xenium Ductal Carcinoma In Situ data
This 10x Xenium data is from [Janesick et al., 2022]
df_spots_all = br.datasets.xenium_dcis_janesick()
visualize_spots(df_spots_all)
Downloading dataset `xenium_dcis_janesick` from `https://figshare.com/ndownloader/files/41409108` as `None.tsv`

6. MERFISH Ileum data
This MERFISH data is from [Petukhov et al., 2022]
df_spots_all = br.datasets.merfish_ileum_petukhov()
visualize_spots(df_spots_all)
Downloading dataset `merfish_ileum_petukhov` from `https://figshare.com/ndownloader/files/41409102` as `None.tsv`
